


Digital Biz PLR
Digital Product Business Tracker PLR
Digital Product Business Tracker PLR
Couldn't load pickup availability
Share
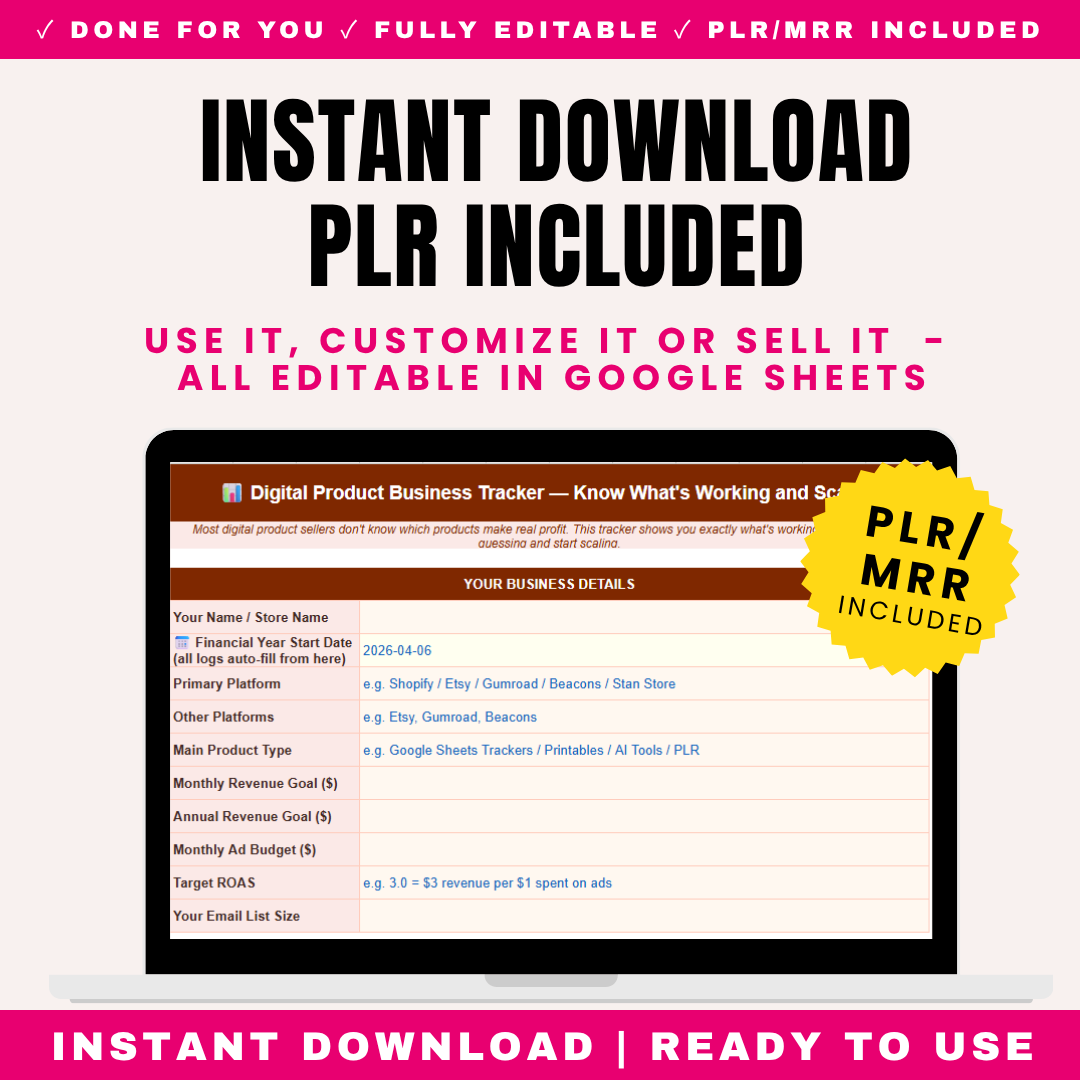
Digital Products Business Tracker - Finally Know Which Products, Platforms & Ads Actually Make You Money
You're selling digital products across Shopify, Etsy, Gumroad, maybe TikTok Shop. Money's coming in. But you have no idea: Which products are actually profitable after ad spend? Which platform makes you the most? Are your Facebook ads making money or losing it? Which email campaigns drove sales?
You think you're growing, but you can't prove it. You're spending on ads but don't know your ROAS. You launch new products constantly but don't know if your existing ones are even profitable. You're busy, but are you actually building a business or just spinning plates?
This Digital Products Business Tracker ends the guesswork. It shows you exactly what's working: total revenue, expenses, net profit, profit margin, ROAS (return on ad spend), your best-selling product, your most profitable platform, average order value, and total orders - all auto-calculated on one dashboard.
Twelve sheets. 100-product profitability tracker (revenue, orders, profit AFTER ads per product). 500-row revenue log with platform fees auto-deducted. 500-row expense log with digital product categories. 10-platform breakdown comparing Shopify, Etsy, Gumroad, Beacons, Stan Store, TikTok Shop, Amazon KDP and more side-by-side. 365-day ad spend tracker with CTR and ROAS auto-calculating daily. Email performance tracker showing which campaigns drove sales. Monthly review across all metrics.
Built specifically for digital product sellers - not generic business tracking. Understands platform fees, ad spend ROAS, email marketing conversion, multi-platform selling, and the unique economics of digital products (high margins, ad-dependent traffic, platform diversification).
Includes "Before You Start" sheet explaining the 5 problems this solves, plus a plain-English guide to key metrics: ROAS, profit margin, AOV, email conversion rate, and cost per acquisition. No jargon - real understanding of the numbers that determine whether your digital product business thrives or dies.
Whether you sell printables, templates, courses, ebooks, PLR products, digital planners, presets, or any digital product across single or multiple platforms - this tracker reveals the truth about your business and shows you exactly where to double down.
🛍️ What's Inside The Digital Products Business Tracker
Sheet 1: Dashboard (Your Business Command Center)
9 Auto-Calculated Key Metrics (Real-Time Business Health):
| Metric | What It Shows | Why It Matters |
|---|---|---|
| Total Revenue | Sum of all sales across all platforms | Top-line number - how much money came in |
| Total Expenses | Sum of all business costs (ads, tools, fees, etc.) | What it costs to run your business |
| Net Profit | Auto-calculates: Revenue minus Expenses | The money you ACTUALLY made. Revenue means nothing if expenses eat it all. |
| Profit Margin % | Auto-calculates: (Net Profit ÷ Revenue) × 100 | Digital products should have 60-90% margins. Below 40% = ads eating profit or pricing too low. |
| ROAS | Auto-calculates: Ad Revenue ÷ Ad Spend | Return on ad spend. ROAS of 3 = £3 revenue per £1 ad spend. Below 2 usually = unprofitable. |
| Best Product | Auto-identifies top revenue product | What's actually selling? Focus energy here. |
| Best Platform | Auto-identifies highest net-revenue platform | Where should you concentrate? Stop spreading thin. |
| Average Order Value (AOV) | Auto-calculates: Total Revenue ÷ Total Orders | Higher AOV = more profit per customer. Track if bundling/upsells working. |
| Total Orders | Count of all orders across platforms | Volume indicator. Growing or stagnant? |
Visual Progress Bars Toward Goals:
Monthly Revenue Goal:
- Set monthly target (e.g., £3,000)
- Dashboard shows current month revenue
- Progress bar fills toward goal
- Percentage achieved + on-track indicator (🟢🟡🔴)
Annual Revenue Goal:
- Set yearly target (e.g., £40,000)
- Cumulative year-to-date tracking
- Pace indicator - are you on track to hit annual goal?
Why This Dashboard Matters: Open tracker, instantly see: Am I profitable? What's my ROAS? Which product/platform wins? Am I hitting goals? No spreadsheet diving, no manual math. Business clarity in 10 seconds.
Sheet 2: Before You Start (5 Problems + Key Metrics Decoded)
The 5 Problems This Tracker Solves:
PROBLEM 1: YOU DON'T KNOW WHICH PRODUCTS ARE PROFITABLE AFTER ADS
The Reality: Your "Bestseller" generates £2,000/month revenue. Feels great. But you spend £1,400/month on ads driving traffic to it. After platform fees (£200), actual profit = £400. Meanwhile, your "small" product generates £600 with zero ad spend (organic/email) = £540 profit. Your "small" product is MORE profitable. Without tracking profit-after-ads per product, you'd scale the wrong one.
PROBLEM 2: YOU DON'T KNOW WHICH PLATFORM PERFORMS BEST
The Reality: You sell on Shopify, Etsy, and Gumroad. Etsy "feels" busiest (lots of orders). But Etsy takes 6.5% + listing fees + ad fees, and AOV is low (£12). Shopify has fewer orders but AOV is £45 and you keep more. Platform Breakdown shows net revenue after fees per platform - revealing where you ACTUALLY make money.
PROBLEM 3: YOUR ADS SPEND MONEY BUT YOU'RE UNSURE IF PROFITABLE
The Reality: You spend £50/day on Facebook ads. Sales happen. But are ads profitable? Ad Spend Tracker calculates ROAS daily. You discover: Monday-Wednesday ROAS is 4.2 (profitable). Thursday-Sunday ROAS is 1.1 (losing money). Solution: only run ads Mon-Wed, save 50% of ad spend, keep most of the revenue.
PROBLEM 4: YOU LAUNCH PRODUCTS CONSTANTLY WITHOUT KNOWING IF EXISTING ONES WORK
The Reality: "New product" dopamine. You've launched 23 products this year. But 4 products generate 80% of revenue. The other 19 generate almost nothing but consumed weeks of creation time. Product Tracker shows this clearly. Stop launching. Start optimizing your winners.
PROBLEM 5: YOU'RE BUSY BUT CAN'T PROVE GROWTH
The Reality: You work constantly. Feel productive. But are you growing? Monthly Review shows objectively: Month 1 profit £800, Month 6 profit £820. Six months of work, basically flat. The data forces honesty. Then you fix it (cut losers, double down on winners, raise prices).
Key Metrics Guide (Plain English - No Jargon):
| Metric | What It Means | How to Calculate | Good Number |
|---|---|---|---|
| ROAS (Return on Ad Spend) | How much revenue you get per £1 spent on ads | Revenue ÷ Ad Spend | 3+ (you make £3 per £1 spent). Below 2 usually unprofitable after costs. |
| Profit Margin | What percentage of revenue is actual profit | (Net Profit ÷ Revenue) × 100 | Digital products: 60-90%. The whole point of digital is high margin. |
| AOV (Average Order Value) | Average amount each customer spends per order | Total Revenue ÷ Total Orders | Higher is better. Increase with bundles, upsells, higher pricing. |
| Email CVR (Conversion Rate) | Percentage of email clickers who buy | (Orders ÷ Clicks) × 100 | 2-5% is decent for email. Below 1% = wrong product or weak offer. |
| CPA (Cost Per Acquisition) | How much it costs in ads to get one customer | Ad Spend ÷ Orders | Must be lower than your profit per order. If CPA is £15 but profit per sale is £10, you're losing money. |
Why Understanding These Matters: Most digital product sellers don't know these numbers. They "feel" successful based on revenue. But revenue without understanding ROAS, margin, and CPA is how people work full-time and still lose money. These 5 metrics determine whether you have a business or an expensive hobby.
Sheet 3: Product Tracker (100 Products - Which Ones Actually Make Money?)
Track up to 100 products with profit-after-ads auto-calculating per product.
What to Track for Each Product:
| Column | What It Shows |
|---|---|
| Product Name | Your product |
| Product Type | Printable, template, course, ebook, planner, PLR, preset, bundle, etc. |
| Launch Date | When you released it |
| Platform(s) Sold On | Where it's listed |
| Price | Selling price |
| Total Revenue | Auto-sums all sales of this product from Revenue Log |
| Total Orders | Number of times sold |
| Ad Spend Allocated | How much ad spend drove this product |
| Platform Fees | Fees paid on this product's sales |
| Profit After Ads | AUTO-CALCULATES: Revenue minus Ad Spend minus Platform Fees |
| Profit Margin % | Auto-calculates: Profit ÷ Revenue × 100 |
Auto-Ranking:
- Top Earning Product: Highest profit after ads (auto-identified)
- Products Ranked by Profitability: See winners and losers instantly
The Revelation Example:
| Product | Revenue | Ad Spend | Platform Fees | Profit After Ads | Margin |
|---|---|---|---|---|---|
| Mega Bundle | £3,000 | £2,100 | £300 | £600 | 20% |
| Simple Planner | £800 | £0 (organic) | £80 | £720 | 90% |
| Template Pack | £1,500 | £400 | £150 | £950 | 63% |
What This Reveals: "Mega Bundle" has highest revenue (£3,000) but LOWEST profit (£600) because ads eat everything. "Simple Planner" has lowest revenue (£800) but second-highest profit (£720) at 90% margin (organic, no ads). "Template Pack" is your real winner - £950 profit at healthy 63% margin.
Strategic Decisions:
- Stop pouring ad spend into Mega Bundle (terrible ROAS)
- Find more organic traffic for Simple Planner (incredible margin)
- Scale Template Pack carefully (best balance)
Sheet 4: Revenue Log (500 Rows - Every Sale Tracked with Fees Deducted)
What to Log for Each Sale Entry:
| Date | When sale occurred |
| Product Name | What sold (links to Product Tracker) |
| Platform | Dropdown: Shopify / Etsy / Gumroad / Beacons / Stan Store / TikTok Shop / Amazon KDP / Payhip / Other |
| Number of Orders | How many sold (can log daily/weekly batches) |
| Gross Revenue | Total before platform fees |
| Platform Fee (% or £) | Fee charged by platform (Etsy 6.5%, Gumroad 10%, etc.) |
| Net Revenue | Auto-calculates: Gross minus Platform Fee |
| Payment Received | Y/N (some platforms hold payouts) |
Auto-Calculated Insights:
- Total Gross Revenue: All sales before fees
- Total Net Revenue: What you actually keep after platform fees
- Total Platform Fees Paid: How much platforms took (often shocking)
- Total Orders: Volume across all platforms
Why Net Revenue Matters: You see "£5,000 in sales!" But platform fees took £450. Your net is £4,550. Tracking net (not gross) shows real income. Across a year, platform fees can total thousands - this reveals the true cost of each platform.
Sheet 5: Expense Log (500 Rows - 10 Digital Product Cost Categories)
Common Digital Product Expense Categories (Listed at Top):
| Category | Examples |
|---|---|
| 1. Platform Fees | Shopify subscription, Etsy listing fees, transaction fees |
| 2. Advertising | Facebook ads, Google ads, TikTok ads, Pinterest ads |
| 3. Design Tools | Canva Pro, Adobe Creative Cloud, Figma |
| 4. AI Tools | ChatGPT Plus, Midjourney, Claude, Jasper |
| 5. Email Marketing | Klaviyo, Mailchimp, ConvertKit, Flodesk |
| 6. Shopify Apps/Plugins | Upsell apps, review apps, email capture, SEO tools |
| 7. Stock Images/Fonts | Creative Market, Envato, stock photo subscriptions |
| 8. Outsourcing | VAs, designers, copywriters, freelancers |
| 9. Education | Courses, coaching, masterminds, books |
| 10. Other Business Costs | Domain, hosting, accounting, miscellaneous |
Expense Log Columns:
- Date
- Expense Category (dropdown from above)
- Description
- Amount
- Tax Deductible (Y/N)
- Receipt Reference
Auto-Calculated:
- Total expenses
- Expenses by category (where's your money going?)
- Advertising as % of revenue (are ads sustainable?)
- Tools/subscriptions total (subscription creep check)
Why Category Tracking Matters: You discover you're spending £180/month on tools you barely use (subscription creep). Or advertising is 60% of revenue (unsustainable). Categorized expenses reveal where to cut.
Sheet 6: Platform Breakdown (10 Platforms Compared Side-by-Side)
The ultimate "where should I focus?" analysis.
Platforms Tracked:
- Shopify
- Etsy
- Gumroad
- Beacons
- Stan Store
- TikTok Shop
- Amazon KDP
- Payhip
- Whop
- Other
For Each Platform, Auto-Calculates:
| Metric | What It Shows |
|---|---|
| Total Orders | Volume on this platform |
| Gross Revenue | Sales before fees |
| Platform Fees Paid | What this platform charged you |
| Net Revenue After Fees | Auto-calculates: What you actually keep |
| AOV (Average Order Value) | Auto-calculates: Revenue ÷ Orders for this platform |
| % of Total Revenue | Auto-calculates: This platform's share of your business |
Example Comparison:
| Platform | Orders | Gross Rev | Fees | Net Rev | AOV | % of Total |
|---|---|---|---|---|---|---|
| Shopify | 45 | £2,025 | £60 | £1,965 | £45 | 43% |
| Etsy | 120 | £1,440 | £190 | £1,250 | £12 | 27% |
| Gumroad | 38 | £1,520 | £152 | £1,368 | £40 | 30% |
What This Reveals:
- Etsy: Most orders (120!) but lowest AOV (£12) and highest fees. Lots of work, low return per sale.
- Shopify: Fewer orders (45) but highest AOV (£45) and lowest fees. Best profit per order.
- Gumroad: Solid middle - good AOV (£40), reasonable fees.
Strategic Insight: Etsy feels busy but Shopify/Gumroad are more profitable per order. Consider: driving Etsy buyers to Shopify, raising Etsy prices, or focusing energy on higher-AOV platforms.
Sheet 7: Ad Spend Tracker (365 Days - Is Each Day Profitable?)
365 rows with dynamic start date. Track ad performance daily with ROAS auto-calculating.
Daily Ad Tracking Columns:
| Date | Auto-populates from start date |
| Platform | Facebook, Google, TikTok, Pinterest, etc. |
| Ad Spend | How much you spent today |
| Impressions | How many times ads shown |
| Clicks | How many clicked |
| Orders | Sales generated from ads |
| Revenue | Revenue from ad-driven orders |
| CTR (Click-Through Rate) | Auto-calculates: (Clicks ÷ Impressions) × 100 |
| ROAS | Auto-calculates: Revenue ÷ Ad Spend |
| CPA (Cost Per Acquisition) | Auto-calculates: Ad Spend ÷ Orders |
Auto-Calculated Totals:
- Total Ad Spend: Cumulative spend
- Total Ad Revenue: Revenue attributed to ads
- Overall ROAS: Total revenue ÷ total spend
- Average CTR: Engagement rate
- Average CPA: Cost to acquire each customer
The Profitability Reveal:
ROAS Benchmarks:
- ROAS 4+: 🟢 Highly profitable, scale this
- ROAS 2.5-4: 🟢 Profitable, maintain/optimize
- ROAS 1.5-2.5: 🟡 Marginal - check if profitable after ALL costs
- ROAS below 1.5: 🔴 Likely losing money, pause and fix
Pattern Discovery Example: "My overall ROAS looks fine at 2.8. But daily tracking shows: weekday ROAS 4.1, weekend ROAS 1.2. I'm profitable weekdays, losing money weekends. Solution: pause weekend ads, save 40% spend, lose only 15% revenue. Net profit increases."
Sheet 8: Email & Marketing (200 Sends - Find Your Winning Formula)
Track 200 email campaigns to identify what actually drives sales.
What to Track for Each Email:
| Date | When sent |
| Subject Line | Exact subject (identify winning formulas) |
| Product Promoted | What you were selling |
| List Size at Send | How many subscribers received it |
| Emails Opened | How many opened |
| Links Clicked | How many clicked through |
| Orders Generated | Sales from this email |
| Revenue Generated | Money from this email |
| Open Rate | Auto-calculates: (Opens ÷ List Size) × 100 |
| Click Rate | Auto-calculates: (Clicks ÷ Opens) × 100 |
| Conversion Rate | Auto-calculates: (Orders ÷ Clicks) × 100 |
| Revenue Per Email | Auto-calculates: Revenue ÷ List Size |
What You Learn Over Time:
- Winning subject lines: Which get highest open rates? (Curiosity? Urgency? Benefit? Personalization?)
- Best products to email: Which products convert best via email?
- Optimal email length/style: Track what works
- Revenue per email: Is your list profitable? (£0.50+ per subscriber per email is strong)
Example Insights:
| Subject Line Style | Avg Open Rate | Avg Conversion |
|---|---|---|
| Curiosity ("You're making this mistake...") | 34% | 4.2% |
| Urgency ("24 hours left") | 28% | 6.8% |
| Benefit ("Save 10 hours per week") | 31% | 3.1% |
Insight: Curiosity subjects get most OPENS, but Urgency subjects get most SALES. Your winning formula: curiosity to get opened, urgency to drive action. Combine them.
Sheet 9: Monthly Review (12-Month Side-by-Side)
Auto-pulls from all sheets to show trends across the year.
What Auto-Populates Per Month:
REVENUE: Total revenue, net revenue, orders, AOV
EXPENSES: Total expenses, ad spend, biggest cost category
PROFIT: Net profit, profit margin
AD PERFORMANCE: Total ad spend, ROAS, best platform
EMAIL PERFORMANCE: Emails sent, average open rate, email revenue
LIST GROWTH: Subscriber count, growth rate
PRODUCTS: New products launched, best seller
Visual Indicators:
- Best month (highest profit) highlighted
- Worst month highlighted
- Trends: growing, stable, declining
Sheet 10: Annual Overview (Full Year + Next Year Planning)
This Year Summary (Auto-Calculated):
- Total annual revenue & net revenue
- Total expenses & net profit
- Profit margin for year
- Total orders & AOV
- Best product & best platform
- Total ad spend & overall annual ROAS
- Total emails sent & email revenue
- Email list growth
Next Year Goal-Setting:
- Revenue goal (e.g., grow from £40K to £60K)
- Profit margin target (e.g., improve from 50% to 65%)
- Ad budget allocation (how much to invest)
- Products to launch (focused, not scattered)
- Platforms to add or drop
- Email list growth goal
Sheet 11: Q&A Problem Solver (10 Real Digital Product Questions)
The Questions with Actionable Answers:
Q1: My product has inconsistent revenue - why?
A: Inconsistent revenue usually means you're dependent on ads (turn off ads = no sales) or relying on launches (spike then silence). Solutions: Build organic traffic (SEO, Pinterest, content) for baseline sales. Build email list for repeat revenue. Create evergreen funnels. Check Product Tracker - if revenue only comes during ad campaigns, you don't have a stable product, you have an ad-dependent one. Fix: improve organic discoverability + email marketing.
Q2: My AOV is too low - how do I increase it?
A: Low AOV kills profitability (especially with ad costs). Increase AOV with: Bundles (combine products at slight discount), Upsells (after purchase, offer related product), Order bumps (add-on at checkout), Tiered pricing (basic/standard/premium), Raising prices (test it - often little resistance). Check Platform Breakdown - if Etsy AOV is £12 but Shopify is £45, focus on the higher-AOV platform or bring Etsy buyers to Shopify for more products.
Q3: I get clicks but no sales - what's wrong?
Q4: When should I scale vs pause ads?
Q5: My email click rates are low - how to fix?
Q6: How often should I email my list?
Q7: Which platform should I focus on?
Q8: Should I build new products or improve existing?
Q9: How do I scale from £2-3K to £5K per month?
Q10: How do I build true passive income?
All 10 questions answered with evidence-based, actionable strategies specific to digital product businesses.
Sheet 12: How To Use (Routines + Doubling Down Rules)
Daily 10-Minute Routine:
- Log yesterday's sales per platform (Revenue Log)
- Log ad spend and results (Ad Spend Tracker)
- Log any expenses (Expense Log)
- Update Product Tracker if needed
- Check Dashboard - quick health glance
Weekly Tasks:
- Review ROAS - pause losing ads, scale winning ads
- Check best-performing products
- Plan email campaigns based on what's working
Monthly Tasks:
- Complete Monthly Review
- Calculate profit margin
- Identify doubling-down opportunities
The Doubling Down Rules (Built In):
The core principle of scaling a digital product business:
- Double down on profitable PRODUCTS - Pour energy into your top 3 earners, not new launches
- Double down on profitable PLATFORMS - Focus where AOV and margins are highest
- Double down on profitable ADS - Scale ROAS 4+ campaigns, kill ROAS under 2
- Double down on winning EMAILS - Repeat subject line formulas that convert
- CUT the losers ruthlessly - Unprofitable products, platforms, ads, and campaigns drain resources
Most sellers spread thin across everything. Winners identify what works and pour everything into it.
Disclaimer & Full PLR Rebrand Guide
🎯 Who This Tracker Is For
Personal Use:
- ✓ Digital product sellers - Printables, templates, planners, courses
- ✓ PLR/MRR sellers - Reselling done-for-you products
- ✓ Etsy digital sellers - Tracking beyond Etsy's basic stats
- ✓ Shopify store owners - Multi-product digital stores
- ✓ Course creators - Tracking course sales and ad performance
- ✓ Multi-platform sellers - Selling across Shopify, Etsy, Gumroad, etc.
- ✓ Ad-running sellers - Anyone spending on Facebook/Google/TikTok ads
- ✓ Email marketers - Tracking email campaign performance
- ✓ Print-on-demand sellers - Tracking product profitability
- ✓ Anyone building a digital product business
Professional Use (PLR/MRR):
- ✓ Digital product coaches - Give to students tracking their businesses
- ✓ E-commerce consultants - Tool for digital product clients
- ✓ Course creators teaching digital products - Include as course resource
- ✓ Business mentors - Help mentees track and scale
- ✓ Agencies - Track client digital product performance
💰 Includes Full PLR and MRR Rights
- ✅ Use for your own digital product business
- ✅ Rebrand with your business name
- ✅ Sell as your own product
- ✅ Give to students and clients
- ✅ Include in courses teaching digital products
- ✅ Bundle with business resources
- ✅ Customize for specific niches
- ✅ Offer MRR rights to buyers
📦 What You Get Immediately
- ✅ 12-Sheet Google Sheets System
- ✅ Dashboard with 9 Auto-Calculated Metrics + ROAS
- ✅ Visual Progress Bars (Monthly & Annual Goals)
- ✅ Key Metrics Guide (ROAS, Margin, AOV, CVR, CPA Explained)
- ✅ 100-Product Profitability Tracker (Profit After Ads)
- ✅ 500-Row Revenue Log (Net After Platform Fees)
- ✅ 500-Row Expense Log (10 Digital Product Categories)
- ✅ 10-Platform Breakdown (Side-by-Side Comparison)
- ✅ 365-Day Ad Spend Tracker (ROAS, CTR, CPA Auto-Calculating)
- ✅ Email Performance Tracker (200 Sends)
- ✅ Monthly Review (12-Month Comparison)
- ✅ Annual Overview with Goal-Setting
- ✅ Q&A Problem Solver (10 Questions)
- ✅ Doubling Down Rules Built In
- ✅ Full PLR and MRR Rights
❓ FAQ
How is this different from the Freelancer Business Tracker?
The Freelancer Tracker focuses on client work, billable hours, and project income. This Digital Products Tracker focuses on PRODUCT sales, ad spend ROAS, multi-platform selling, and email marketing - the specific economics of selling digital products at scale.
Do I need to run ads to use this?
No! If you don't run ads, simply skip the Ad Spend Tracker. The product, revenue, platform, and email tracking work perfectly for organic-only sellers. But if you DO run ads, the ROAS tracking is invaluable.
What if I only sell on one platform?
Still useful! Even single-platform sellers benefit from product profitability tracking, expense tracking, ad ROAS, and email performance. The Platform Breakdown just shows one platform.
Does this connect to Shopify/Etsy automatically?
No - this is a manual tracking system (you input your data). This is intentional: it forces you to engage with your numbers, works across ALL platforms (not just ones with integrations), and you own your data completely with no monthly software fees.
Can I track multiple currencies?
Use one base currency throughout. If selling in multiple currencies, convert to your base currency when logging.
How long to set up?
15 minutes initial setup (enter products, start date, goals). Then 10 minutes daily logging. The clarity is worth it.
Can coaches rebrand for students?
Yes! Full PLR/MRR rights. Perfect for digital product courses and coaching programs.
🛍️ Stop Guessing. Know Exactly What Makes Money. Scale With Confidence.
Digital Products Business Tracker. Twelve sheets. Complete revenue, profit, ad spend and multi-platform sales system. Includes: Dashboard (9 auto-calculated metrics total-revenue/expenses/net-profit/profit-margin/ROAS/best-product/best-platform/AOV/total-orders, visual progress bars monthly-annual-goals), Before You Start (5 problems solved don't-know-which-products-profitable-after-ads/which-platform-best/if-ads-profitable/launching-without-knowing-if-existing-works/busy-but-can't-prove-growth, key-metrics-guide-plain-English ROAS-profit-margin-AOV-email-CVR-CPA explained), Product Tracker (100 products revenue-orders-ad-spend-platform-fees/profit-after-ads auto-calculates/profit-margin-per-product, identifies top-earner), Revenue Log (500 rows date-product-platform-orders-gross-revenue-platform-fee/net-revenue auto-calculates, total-gross-net-fees-orders), Expense Log (500 rows 10-categories platform-fees-advertising-design-tools-AI-tools-email-marketing-Shopify-apps-stock-images-outsourcing-education-other/tax-deductible/receipt, totals-by-category), Platform Breakdown (10 platforms Shopify-Etsy-Gumroad-Beacons-Stan-Store-TikTok-Shop-Amazon-KDP-Payhip-Whop-Other, net-revenue-after-fees/AOV/percentage-of-total auto-calculates per-platform, identifies-best-platform), Ad Spend Tracker (365 days dynamic-start-date, spend-impressions-clicks-orders-revenue/CTR auto-calculates/ROAS auto-calculates/CPA auto-calculates per-day, total-spend-revenue-overall-ROAS-average-CTR), Email and Marketing (200 sends subject-line-product-list-size-opens-clicks-orders-revenue/open-rate auto-calculates/click-rate/conversion-rate/revenue-per-email, identifies-winning-formula), Monthly Review (12-month side-by-side revenue-expenses-profit-ad-performance-email-performance-list-growth-products auto-pulling, best-worst-month-trends), Annual Overview (full-year-summary all-metrics, next-year goal-setting revenue-profit-margin-ad-budget-products-platforms-list-growth), Q&A Problem Solver (10 questions inconsistent-revenue/low-AOV/clicks-without-sales/scale-vs-pause-ads/low-click-rates/email-frequency/platform-choice/build-new-vs-improve/scaling-2-3K-to-5K/passive-income), How To Use (daily-10-minute-routine, weekly-monthly-tasks, doubling-down-rules double-down-on-profitable-products-platforms-ads-emails-cut-losers, disclaimer, full-PLR-rebrand-guide). All formulas auto-calculate. Professional business aesthetic. Mobile-friendly Google Sheets. Full PLR and MRR Rights. One-time fee. Instant access.
Twelve-sheet Google Sheets system for digital product business management. Includes: Dashboard (9 auto-calculated metrics total-revenue/total-expenses/net-profit/profit-margin-percentage/ROAS-return-on-ad-spend/best-product-by-revenue/best-platform-by-net-revenue/average-order-value-AOV/total-orders pulling from all sheets, visual progress bars monthly-annual-revenue-goals percentage-completion, quick-glance business health indicators), Before You Start (5 problems this tracker solves honest-explanations Problem-1-Don't-know-which-products-profitable-after-ads/Problem-2-Don't-know-which-platform-performs-best/Problem-3-Ads-spending-money-unsure-if-profitable/Problem-4-Launching-products-constantly-without-knowing-if-existing-ones-work/Problem-5-Busy-but-can't-prove-growth, key-metrics-guide-plain-English ROAS-explained-revenue-divided-by-ad-spend/profit-margin-explained-profit-divided-by-revenue/AOV-explained-revenue-divided-by-orders/email-CVR-explained-orders-divided-by-clicks/CPA-explained-ad-spend-divided-by-orders), Product Tracker (100 products product-name/product-type/launch-date/platform-sold-on/price/total-revenue auto-sums from Revenue Log/total-orders/ad-spend-allocated/profit-after-ads auto-calculates revenue-minus-ad-spend-minus-platform-fees/profit-margin-per-product, auto-identifies top-earning-product, ranks products by profitability), Revenue Log (500 rows date/product-name/platform dropdown Shopify-Etsy-Gumroad-Beacons-Stan-Store-TikTok-Shop-Amazon-KDP-Payhip-Other/number-of-orders/gross-revenue/platform-fee-percentage-or-amount/net-revenue auto-calculates gross-minus-fees/payment-received Y-N, auto-calculates total-gross-revenue/total-net-revenue/total-platform-fees-paid/total-orders, feeds Dashboard), Expense Log (500 rows date/expense-category dropdown with-10-common-digital-product-categories Platform-fees-Shopify-Etsy/Advertising-Facebook-Google-TikTok-Pinterest/Design-tools-Canva-Adobe/AI-tools-ChatGPT-Midjourney-Claude/Email-marketing-Klaviyo-Mailchimp-ConvertKit/Shopify-apps-plugins/Stock-images-fonts/Outsourcing-VA-designers/Education-courses-coaching/Other-business-costs/description/amount/tax-deductible Y-N/receipt-reference, common categories listed at top for reference, auto-calculates total-expenses-by-category, feeds Dashboard), Platform Breakdown (10 platforms side-by-side Shopify-Etsy-Gumroad-Beacons-Stan-Store-TikTok-Shop-Amazon-KDP-Payhip-Whop-Other, for-each-platform total-orders/gross-revenue/platform-fees-paid/net-revenue-after-fees auto-calculates/AOV-average-order-value auto-calculates/percentage-of-total-revenue auto-calculates, identifies-best-performing-platform, shows-where-to-focus-energy), Ad Spend Tracker (365 days with dynamic start date auto-populating, date/platform-Facebook-Google-TikTok-Pinterest/ad-spend/impressions/clicks/orders-generated/revenue-generated, CTR-click-through-rate auto-calculates clicks-divided-by-impressions, ROAS-return-on-ad-spend auto-calculates revenue-divided-by-spend, CPA-cost-per-acquisition auto-calculates spend-divided-by-orders, auto-calculates total-ad-spend/total-ad-revenue/overall-ROAS/average-CTR, identifies-profitable-vs-unprofitable-ad-days), Email and Marketing (200 email-sends tracked date/subject-line/product-promoted/list-size-at-send/emails-opened/links-clicked/orders-generated/revenue-generated, open-rate auto-calculates opens-divided-by-list-size, click-rate auto-calculates clicks-divided-by-opens, conversion-rate auto-calculates orders-divided-by-clicks, revenue-per-email auto-calculates, identifies-winning-subject-lines-and-formulas-over-time, shows-which-products-sell-best-via-email), Monthly Review (12-month side-by-side auto-pulling all sheets, Revenue-section total-revenue/net-revenue/orders/AOV, Expenses-section total-expenses/ad-spend/biggest-cost-category, Profit-section net-profit/profit-margin, Ad-performance-section total-spend/ROAS/best-performing-platform, Email-performance-section emails-sent/average-open-rate/email-revenue, List-growth-section subscriber-count/growth-rate, Products-section new-products-launched/best-seller, visual-indicators best-worst-month-trends), Annual Overview (full-year summary total-annual-revenue/net-revenue/expenses/profit/profit-margin/total-orders/AOV/best-product/best-platform/total-ad-spend/overall-annual-ROAS/total-emails-sent/email-revenue/list-growth, next-year goal-setting revenue-goal/profit-margin-target/ad-budget-allocation/products-to-launch/platforms-to-add-or-drop/email-list-growth-goal, year-on-year comparison), Q&A Problem Solver (10 questions My-product-has-inconsistent-revenue-why/My-AOV-is-too-low-how-to-increase/I-get-clicks-but-no-sales-what's-wrong/When-should-I-scale-vs-pause-ads/My-email-click-rates-are-low-how-to-fix/How-often-should-I-email-my-list/Which-platform-should-I-focus-on/Should-I-build-new-products-or-improve-existing/How-do-I-scale-from-2-3K-to-5K-per-month/How-do-I-build-true-passive-income, evidence-based-actionable-answers), How To Use (daily-10-minute-routine log-yesterday's-sales-per-platform/log-ad-spend-and-results/log-any-expenses/update-product-tracker/check-Dashboard, weekly-tasks review-ROAS-pause-losing-ads/check-best-performing-products/plan-email-campaigns, monthly-tasks complete-Monthly-Review/calculate-profit-margin/identify-doubling-down-opportunities, the-doubling-down-rules-built-in double-down-on-profitable-products-platforms-ads-emails-cut-losers, disclaimer not-financial-advice, full-PLR-rebrand-guide). All formulas auto-calculate. Professional business aesthetic. Mobile-friendly Google Sheets. Full PLR and MRR Rights. One-time fee. Instant access.
Perfect for: Digital product sellers, PLR/MRR sellers, Etsy digital sellers, Shopify store owners, course creators, multi-platform sellers, ad-running sellers, email marketers, print-on-demand sellers, digital product coaches, e-commerce consultants, business mentors
Know your numbers. Double down on winners. Cut the losers. Scale with confidence.
Questions? Contact us here
What You Will Receive
What You Will Receive
1 x PDF with instructions - Includes a link to your digital download.
You will receive it straight away! This is a DIGITAL PRODUCT which means no physical item will be shipped to you.
Resell Licence
Resell Licence
Each product has a resell licence attached to it. Please check the individual listing to see if they come with a Personal Use or an MRR & PLR licence. If they come with a MRR & PLR licence then you can rebrand and resell the content. If not, you cannot.
Returns Policy
Returns Policy
Due to the nature of this product being an instant download and the digital nature of this product, returns, refunds and exchanges cannot be accepted.
Make sure to read all the information and ask all of your questions before purchasing.


Did You Know Entrepreneurs Using PLR Products See 40% Higher Profit Margins
-
1. Work Smart, NOT HARD!
Our PLR products come pre-made and ready to customize, allowing you to skip the content creation process. Simply rebrand them with your colors, images etc, tweak as needed, and put them to work for your business.
-
2. If Your Marketing Costs Are High!
Our PLR products include MRR, you can resell these assets to generate additional income, covering your marketing costs and boosting profits.
-
3. Struggling to Stay Consistent?
Our PLR products are easy to use, providing you with a consistent stream of content for marketing, customer engagement, and lead nurturing, so you never run out of ideas.
Save Over 500 Hours Per Year Using Our PLR Products
Frequently Asked Questions
What is the difference between PLR & MRR products?
- Private Label Rights Products: Refers to the digital products that you can customize and sell as your own - WITHOUT the ability to pass on resell rights to your customers.
- Master Resell Rights Products: Refers to the digital products that you can customize and sell as your own - WITH the ability to pass on resell rights to your customers.
What can you do with Digital Biz PLR products?
Here are some ways you can use our digital products:
- Edit, tweak and customise in Canva, export as PDF and start selling as your own with no attribution required
- Use the product to create a new digital product, lead magnet or add to your course or membership
- Sell to your clients as a final product without having to create it from scratch
- Use for Print on Demand products such as journals, planners and ebooks
Are there any hidden or on-going fees?
No, it is just a one-time investment and you can get started!
I'm ready to make money now. How do I start?
Simply Click the "Add To Cart" button on top and make your one-time purchase to get instant access to the product.